Operating organization: Fondazione Edmund Mach
Funding agency: Fondazione Edmund Mach
Abstract:
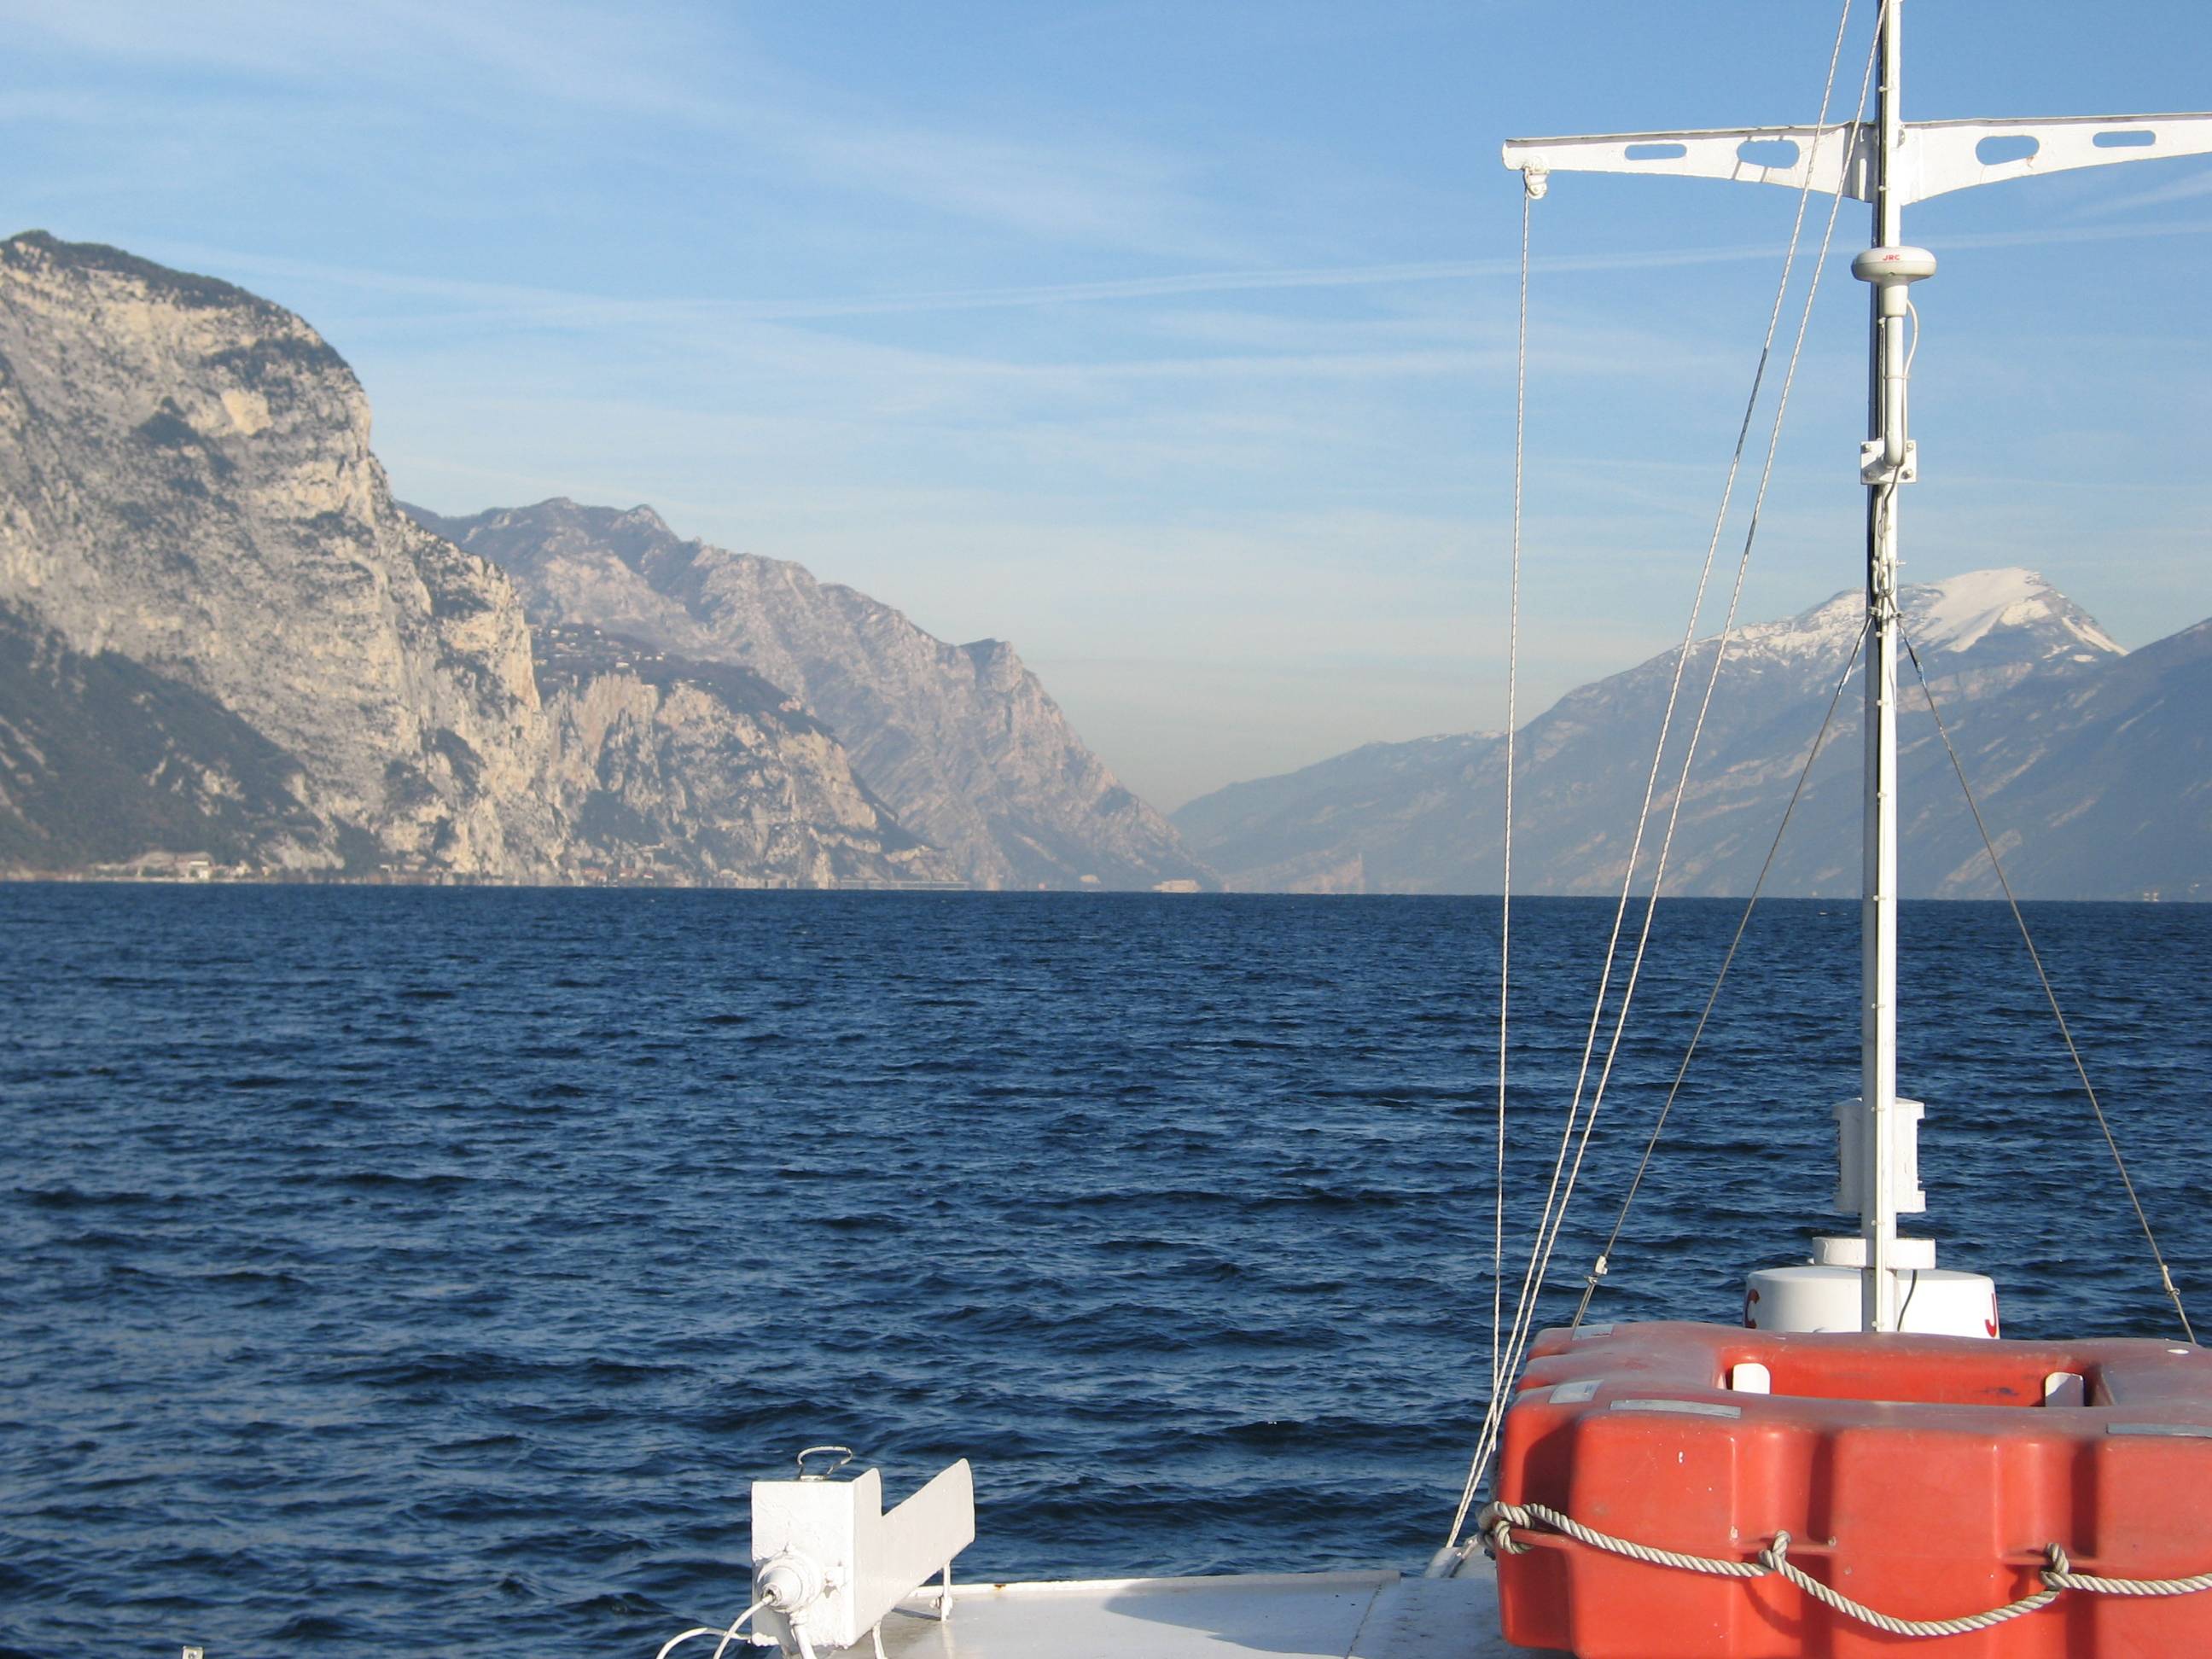
Lake Garda has the largest volume (49 billions of cubic meters) and the most extensive area (368 km2) of Italian lakes. Along with lakes Orta, Maggiore, Lugano, Como, Iseo and Idro, it forms part of the group of deep lakes located south of the Alps in one of the most densely populated and highly productive area of Italy. With a total volume of over 124 billions of cubic meters, these lakes constitute one of the largest freshwater supplies in Europe. Their waters are used for agriculture, industry, fishery and drinking. Moreover, they are an important resource for recreation and tourism thanks to both attractive landscape and water quality. In Lake Garda, sporadic studies were carried out irregularly by various Institutions up to the end of the 1980s. Since the beginning of the 1990s, continuous monthly samplings and measurements were carried out by the Department of Biology of the Padova University (Responsible, Nico Salmaso), with the collaboration of ARPAV. Since 2005 the whole limnological research is performed by the Limnological research group of the Agrarian Institute of S. Michele all’Adige – E. Mach Foundation (S. Michele all’Adige, Trento; coordinator, Nico Salmaso). Since the 1970s, Lake Garda showed an increase in the trophic status, with mean annual concentrations of total phosphorus in the whole water column increasing from ca. 10 µg P/L to 20 µg P/L. In the last 4-5 years of observations, TP showed a stabilisation of the concentrations, around 18 µg P/L. At the community level, annual phytoplankton cycles underwent a unidirectional and slow shift mainly due to changes in the species more affected by the nutrient enrichment of the lake. After a first and long period of dominance by conjugatophytes (Mougeotia) and diatoms (Fragilaria), phytoplankton biomass in recent years was sustained by cyanobacteria (Planktothrix). Other important modifications in the development of phytoplankton were superimposed on this pattern due to the effects of annual climate fluctuations principally mediated by the deep mixing events at spring overturn. Main specific research objectives in this LTER station include: -Changes in the physical, chemical and biological variables at different temporal scales, from months to decades and centuries (paleoecology). Update of the time series of hydrological, climatological and limnological data, whith special attention to lake evolution and effects on biotic communities in relation to ongoing climatic changes. Definition of predictive models. – Identification of the environmental and biotic mechanisms favouring the development of cyanobacteria (including the recent appearence of blooms and new species). Identification of the factors selecting for the development of toxic strains, the production and concentrations of epato- and neurotoxins, and their impact on trophic webs and water usability. The limnological field facilities of the limnological research group include 2 rubber dinghies, 2 multi-parameter probes, a fluoroprobe, a FlowTracker Handheld ADV Sonntek, underwater Quantum sensors, a Kajak corer and an Eckman dredge for sediment sampling. The unit also has several laboratories. These include the hydrobiology and microscopy laboratory, equipped for analyses of basic limnological variables (photosynthetic pigments, dry weight, dissolved oxygen, water turbidity, macrophytes) and of phytoplankton, picoplankton and periphyton samples (microscopes, invertoscopes, fluorescent microscopy, image analysis). The analytical and environmental chemistry laboratory is equipped for analysis of the major ions and nutrients (phosphorus, nitrogen and silica), as well as organic molecules (with focus on cyanotoxins) by means of spectrophotometry, ion chromatography and Liquid Chromatography-Mass Spectrometry (LC-MS). We have access to genetic laboratories equipped with the principal analytical tools, i.e. PCR, electrophoresis, and sequencing. The data collected at monthly frequency since 1991 includes water temperature and oxygen. Phytoplankton was collected since 1993, while complete data recording (including chemistry and zooplankton) begun in 1995.

